Methodology
Everything below is computed from public MLB play-by-play — ~30,000 MLB + AAA games, 2.1M+ plays, 9.5M+ pitches across 2015-2026 — by an engine we built from scratch. No proprietary feeds, no black boxes. The full research write-ups (including the ones where we were wrong) are public — the receipts are linked at the bottom of this page, verbatim from the working files.
The pipeline, validated
We compute our own run expectancy, win probability, and leverage from raw play-by-play. Cross-checked against FanGraphs for 2024 qualified batters: RE24 correlation 0.975, WPA correlation 0.905. When our numbers differ from the field’s, we say so and say why.
The two validated signals
From 1.23M balls in play with launch data, two quantities matter most:
- EV95 — a hitter’s 95th-percentile exit velocity. The most stable metric in our engine (year-over-year r = 0.88).
- The luck gap — actual results on contact minus what the launch physics say they should be, park- adjusted. Mostly transient, which is exactly what a regression signal should be.
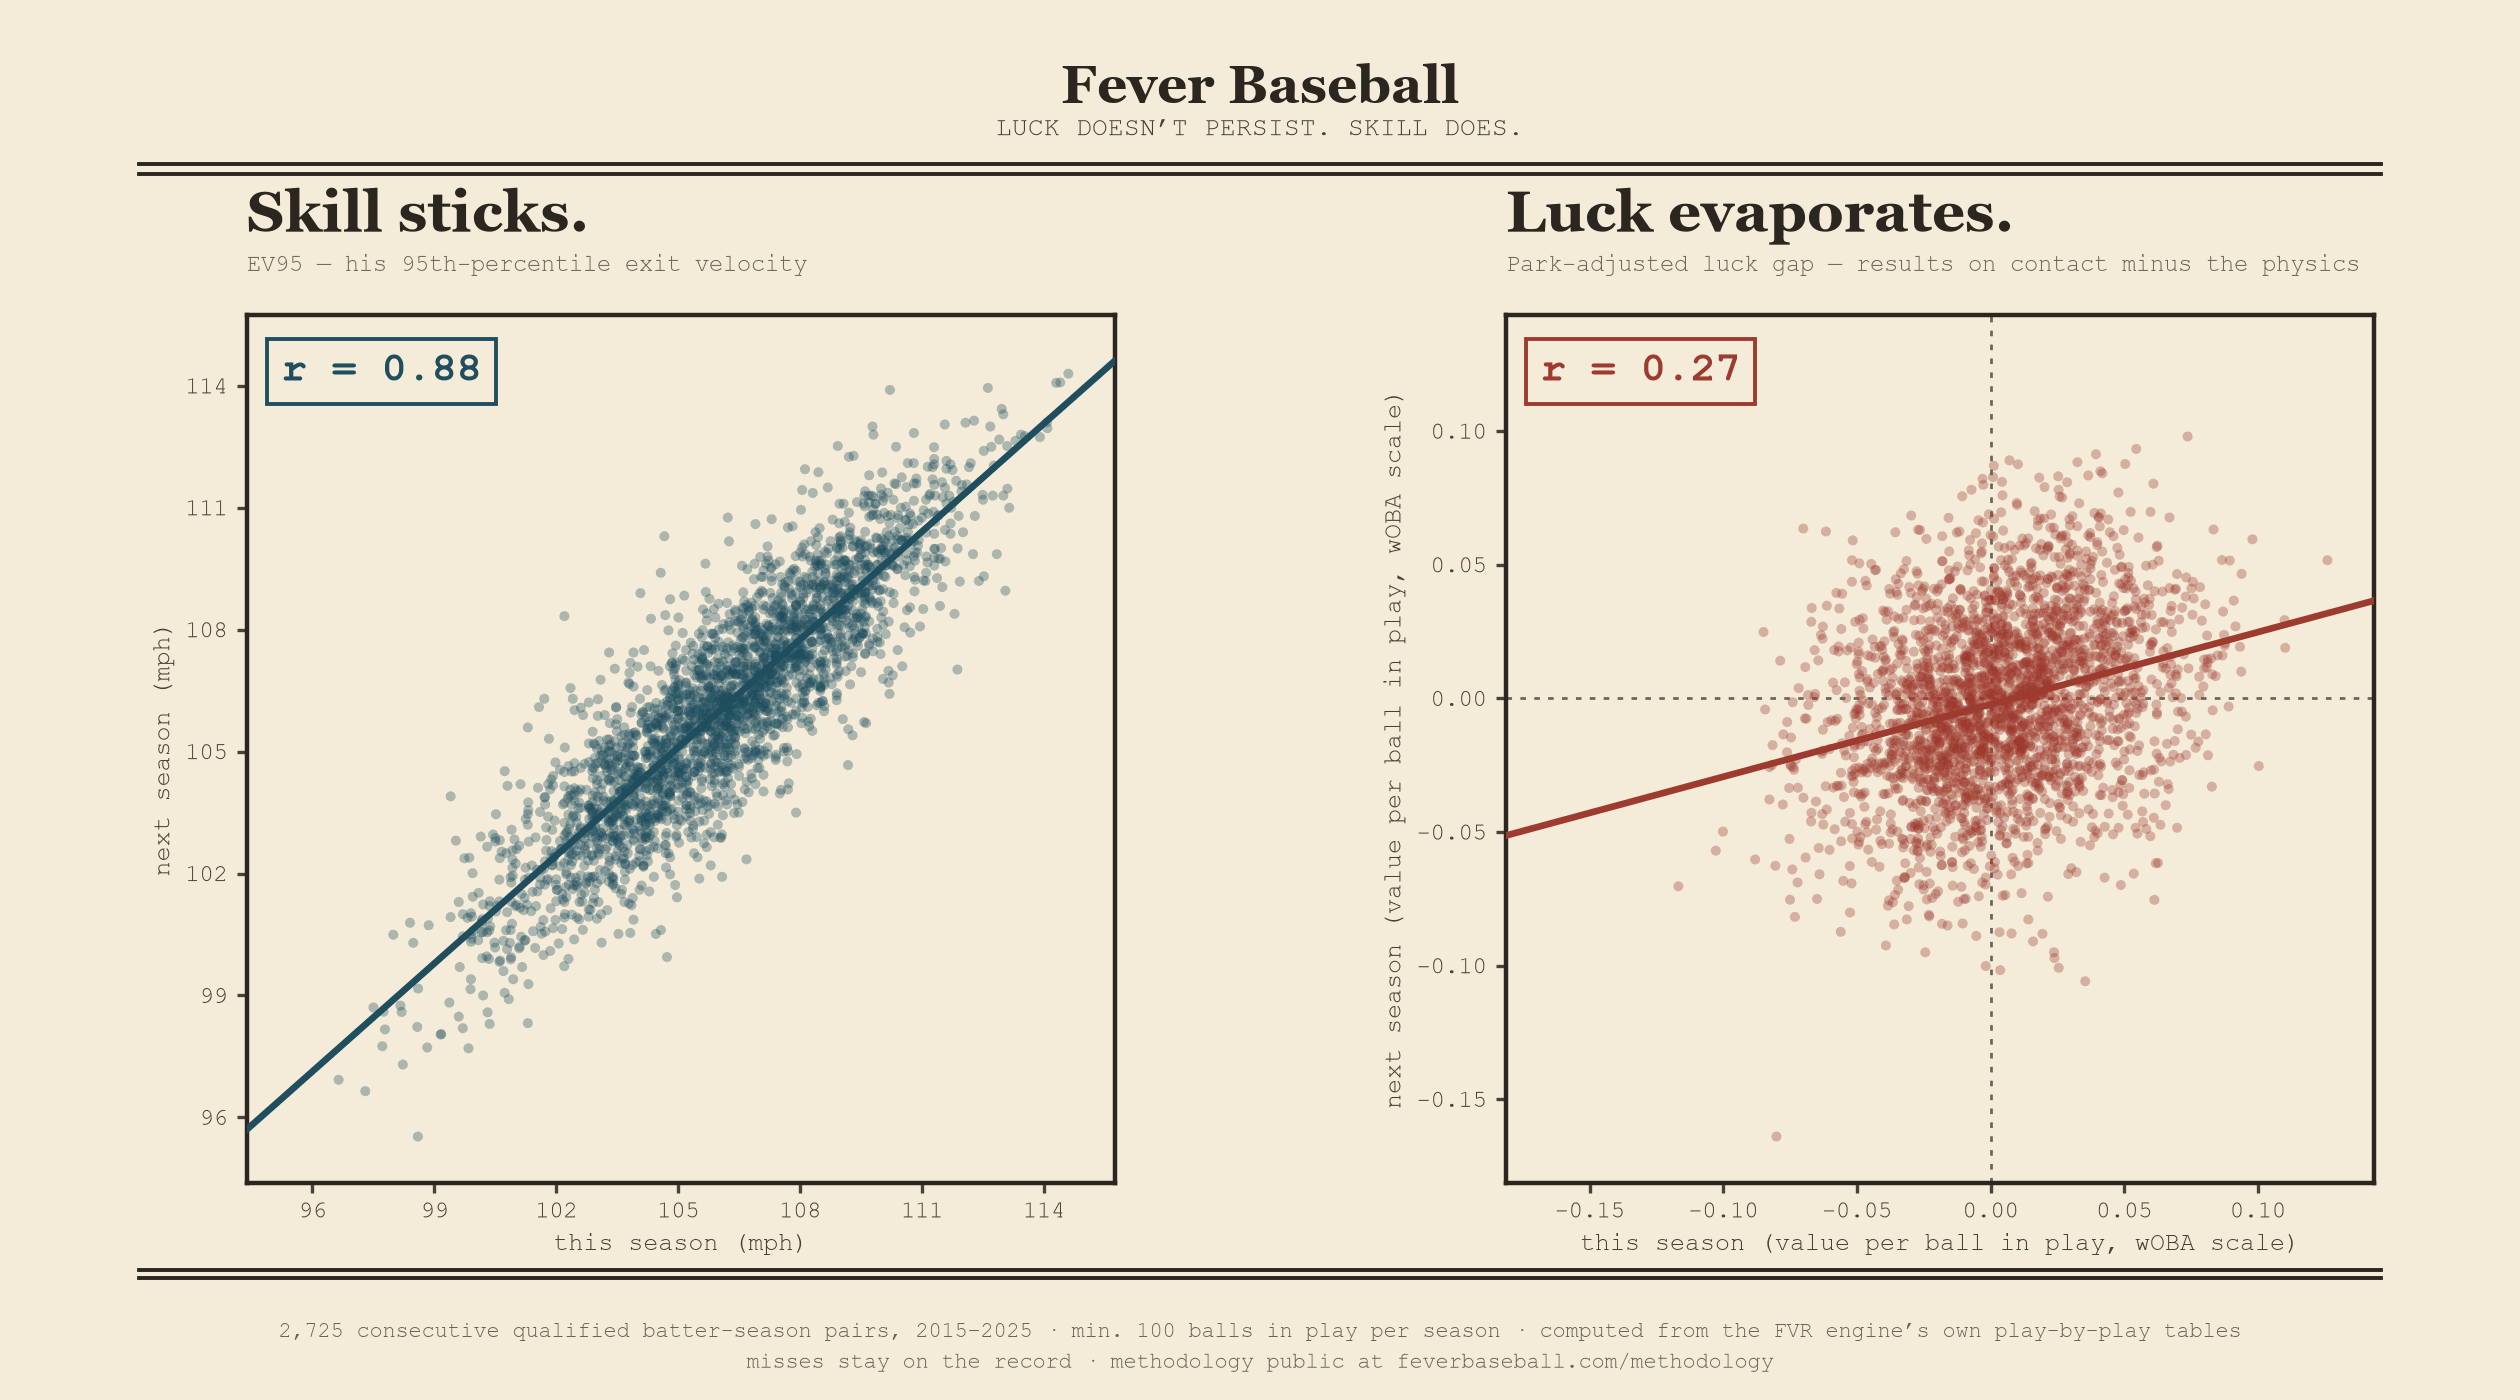
We tested whether these predict future value beyond current performance — and we froze the entire protocol before looking at the test data: models, coefficients, scaling, success criteria, and what we would publish if it failed. One evaluation, published regardless.
On the held-out seasons (n = 721 qualified batter-seasons): the luck gap predicted -0.6234 WAR per SD (p <0.0001), EV95 predicted +0.2746 (p = 0.0165), and the combined signal separated top from bottom quintiles by +1.151 annualized WAR. All pre-registered criteria passed. One metric computation bug was found and disclosed in the results document — because a pre-registration you only cite when convenient is not a pre-registration.
Read that plainly: a hitter one standard deviation up the luck gap — one big step into “his results are outrunning his contact” — gave back about six-tenths of a win the following season. A pattern that large turns up by chance less than once in ten thousand tries. And if you sort every hitter by the two signals together and cut the field into five groups, the top group beat the bottom group by better than a win over a full season. We wrote down what would count as success, froze it in public, ran it once, and this is what came back.
Bonus finding
Along the way we re-derived a classic on our own pipeline: clutch performance is not a repeatable skill (year-over-year r = 0.043 across 2377 qualified batter pairs). We publish results like this even when they are not flattering to the idea of prediction, because that is the point of the site.
What the signals cannot do
- No pitcher board. Our stuff model (year-over-year r = 0.87) is stability-validated but NOT outcome-validated, so it ranks nothing and pitcher rows stay watchlist. One arm signal did clear the same out-of-sample bar — the ERA–FIP luck gap (H-ARMGAP) — and it earns calls, not a board: we now file arm regression calls by hand, and the first is on the ledger.
- MLB only. The Triple-A board runs the same machinery on Triple-A Statcast, but that application is the frontier, not the proven core.
- Residual, not level. The signals rank who is likely to out- or under-perform their current value — they do not rank who is best.
- Means, not certainties. Effects are quintile averages. Individual calls will miss. The ledger counts them.
Sprint calls — a forward test, labeled as one
Season-long calls resolve slowly, so the ledger also carries sprint calls: 30–52 day windows filed on the boards’ largest dislocations (a luck gap of at least 0.05 on 100+ balls in play). The bet is the engine’s core thesis on a clock — results converge toward contact quality. Sprints are filed algorithmically by this rule on Mondays and Thursdays — no cherry-picking — with a 24-hour founder veto for what the engine can’t see (injury news, trades). Vetoes stay on the public ledger. Season-long calls remain human-filed.
Thresholds are set by a published rule, not by feel. A season-to-date number is diluted — six weeks adds only about a third more sample — so the bar is 70% of the gap closing in-window, scaled by that dilution, floored at the noise floor (0.015). That puts a sprint threshold at roughly 1–1.5 standard deviations of six-week noise: winnable when the thesis is right, missable when it isn’t. Honest boundary: the season-scale effect is holdout-validated; the sprint window is a live forward test, and the sprint record — misses included — is how we’ll judge the calibration.
Which number resolves a call, and what that costs us. The boards rank on the park-adjusted luck gap, so that a ballpark never decides who gets flagged. A call resolves on his actual value on contact — not park-adjusted — because what we claimed is that his results would move, and that is the number his results actually are. Two different jobs. Until 2026-07-14 this site described the resolving number as “park-adjusted” in two places. It never was. The code was right and the description was wrong; we fixed the description and left every filed call exactly as filed.
The honest exposure, stated before it can bite us: a park effect is worth up to about 0.08 of contact value, which is larger than a sprint threshold. It mostly cancels, because a call measures the change in one hitter’s number and his ballparks sit on both ends of that subtraction. It stops canceling if he is traded mid-window— his season park mix shifts, and on a 30-day window that is worth roughly 0.01 against thresholds of 0.015–0.025. The trade deadline is July 31 and our first windows close in August, so this is live, not hypothetical. We are not changing the metric mid-flight — that is moving the goalposts, and it is the one thing this ledger exists not to do. The exposure is disclosed, the calls stand, and if one of them turns on a trade we will say so in the resolution.
One hard rule: if a player stops playing mid-window, his number freezes and the call resolves against it at the close. No voids, no do-overs.
The rules we operate under
- Every call filed with metric, threshold, window, and timestamp before it counts.
- Resolution computed, never argued.
- The ledger is append-only; corrections are appended in public, never edited in.
- We take positions in a player’s cards only after the call is published, and disclose when we do.
The receipts
The write-ups this page keeps referring to, published verbatim from the working files:
- The pre-registration — frozen 2026-07-11, before the holdout was touched.
- The confirmatory results — the single holdout run, disclosed bug included.
- The exploratory work — train years only, labeled as such.
- The stability gate — including the clutch null result and why the pitcher board stays unbuilt.
Things we tested and did not ship
Every idea below was pre-registered — the protocol frozen in public, with a success criterion written down, before the data that would judge it was examined. Two of the seven came back no. Four came back yes and still did not become a ranking signal on the boards, which is the part nobody warns you about: a finding can be real and still not earn a place in the rankings. Sometimes the board you build on it is worse than what you had; sometimes it clears the low bar — it carries real signal — and misses the high one that would let it rank; and sometimes it earns a forward-graded call instead, proven in public rather than ranked. They are here because a research page that only shows you the winners is an advertisement.
- Bat speed as an early signal. Pre-registration · results — miss. It worked in both training years and died on its one real test. It does not enter the engine.
- Sprint speed. Pre-registration · results — pass. Our expectation model grades a batted ball on how it was struck and cannot see legs, so fast men beat it every year. The finding held out of sample to the third decimal — and it still did not enter the engine, for the reason directly below.
- The speed-adjusted gap. Pre-registration · results — miss. Having found the bias, we built the board that corrects for it. It picked worse fade candidates than the plain luck gap, in both test years, so we did not ship it — and the sprint speed on the Fade board is printed, never ranked on. The previous receipt carries a correction we appended the same day, when this run refuted a sentence in it.
- The EV95 of pitching. Pre-registration · results — pass. A pitcher's ERA barely repeats from one year to the next; his rate of called strikes and whiffs (CSW%) does, and out of sample it carries real information about next year's ERA beyond the ERA he already has. But it did not out-predict ERA the way EV95 out-predicts results for hitters — it is a complement, not a replacement. So CSW% earns a declared number on the pitcher pages and nothing it can rank on.
- The process signal on a cleaner outcome. Pre-registration · results — pass. The follow-up: we re-ran the whiff-rate test against FIP, the defense-independent version of ERA, in case ERA's fielding luck was hiding the signal. It was not. CSW% adds even more to next year's FIP than to next year's ERA — and still does not beat it. A complement on both, a replacement on neither.
- The pitcher luck gap. Pre-registration · results — pass. The hitter luck gap, pointed at arms: a pitcher's FIP against his ERA. FIP carries real forward information about next year's ERA beyond the ERA itself (the gate passed) — but out of sample it is co-equal to ERA, not the superior gauge the training years showed. It authorizes forward-graded arm calls, which we are filing by hand first; it does not authorize a ranked board.