The methodology, illustrated
The One Chart
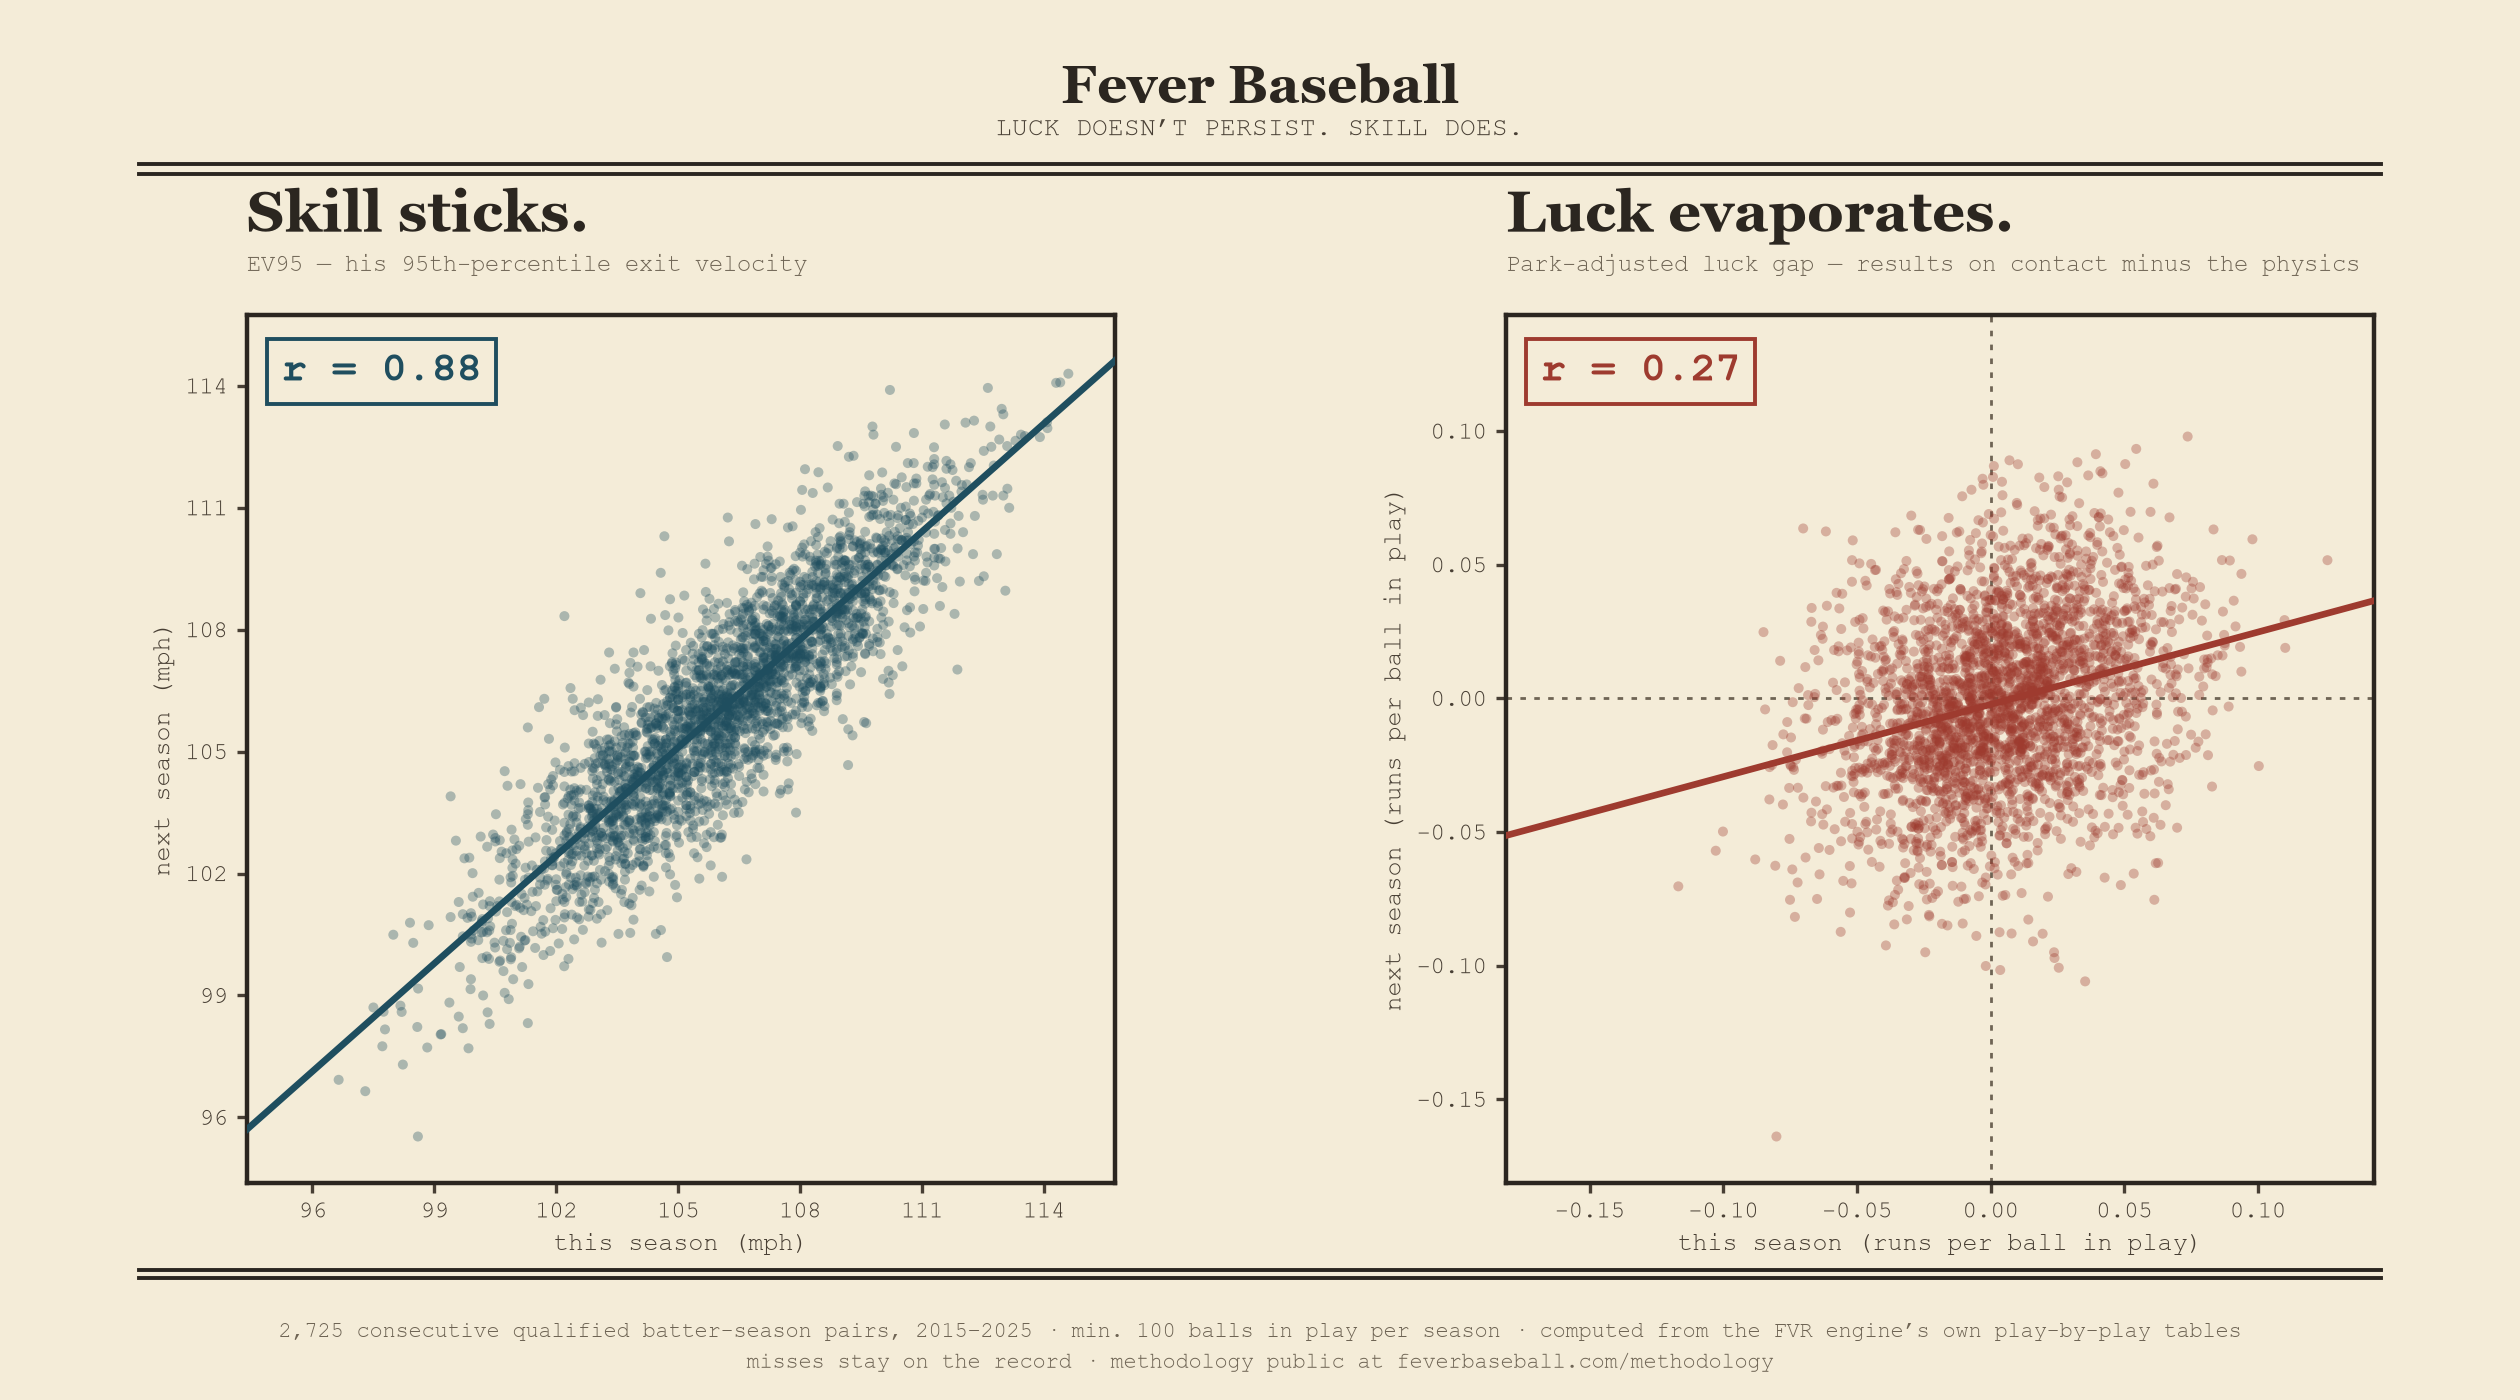
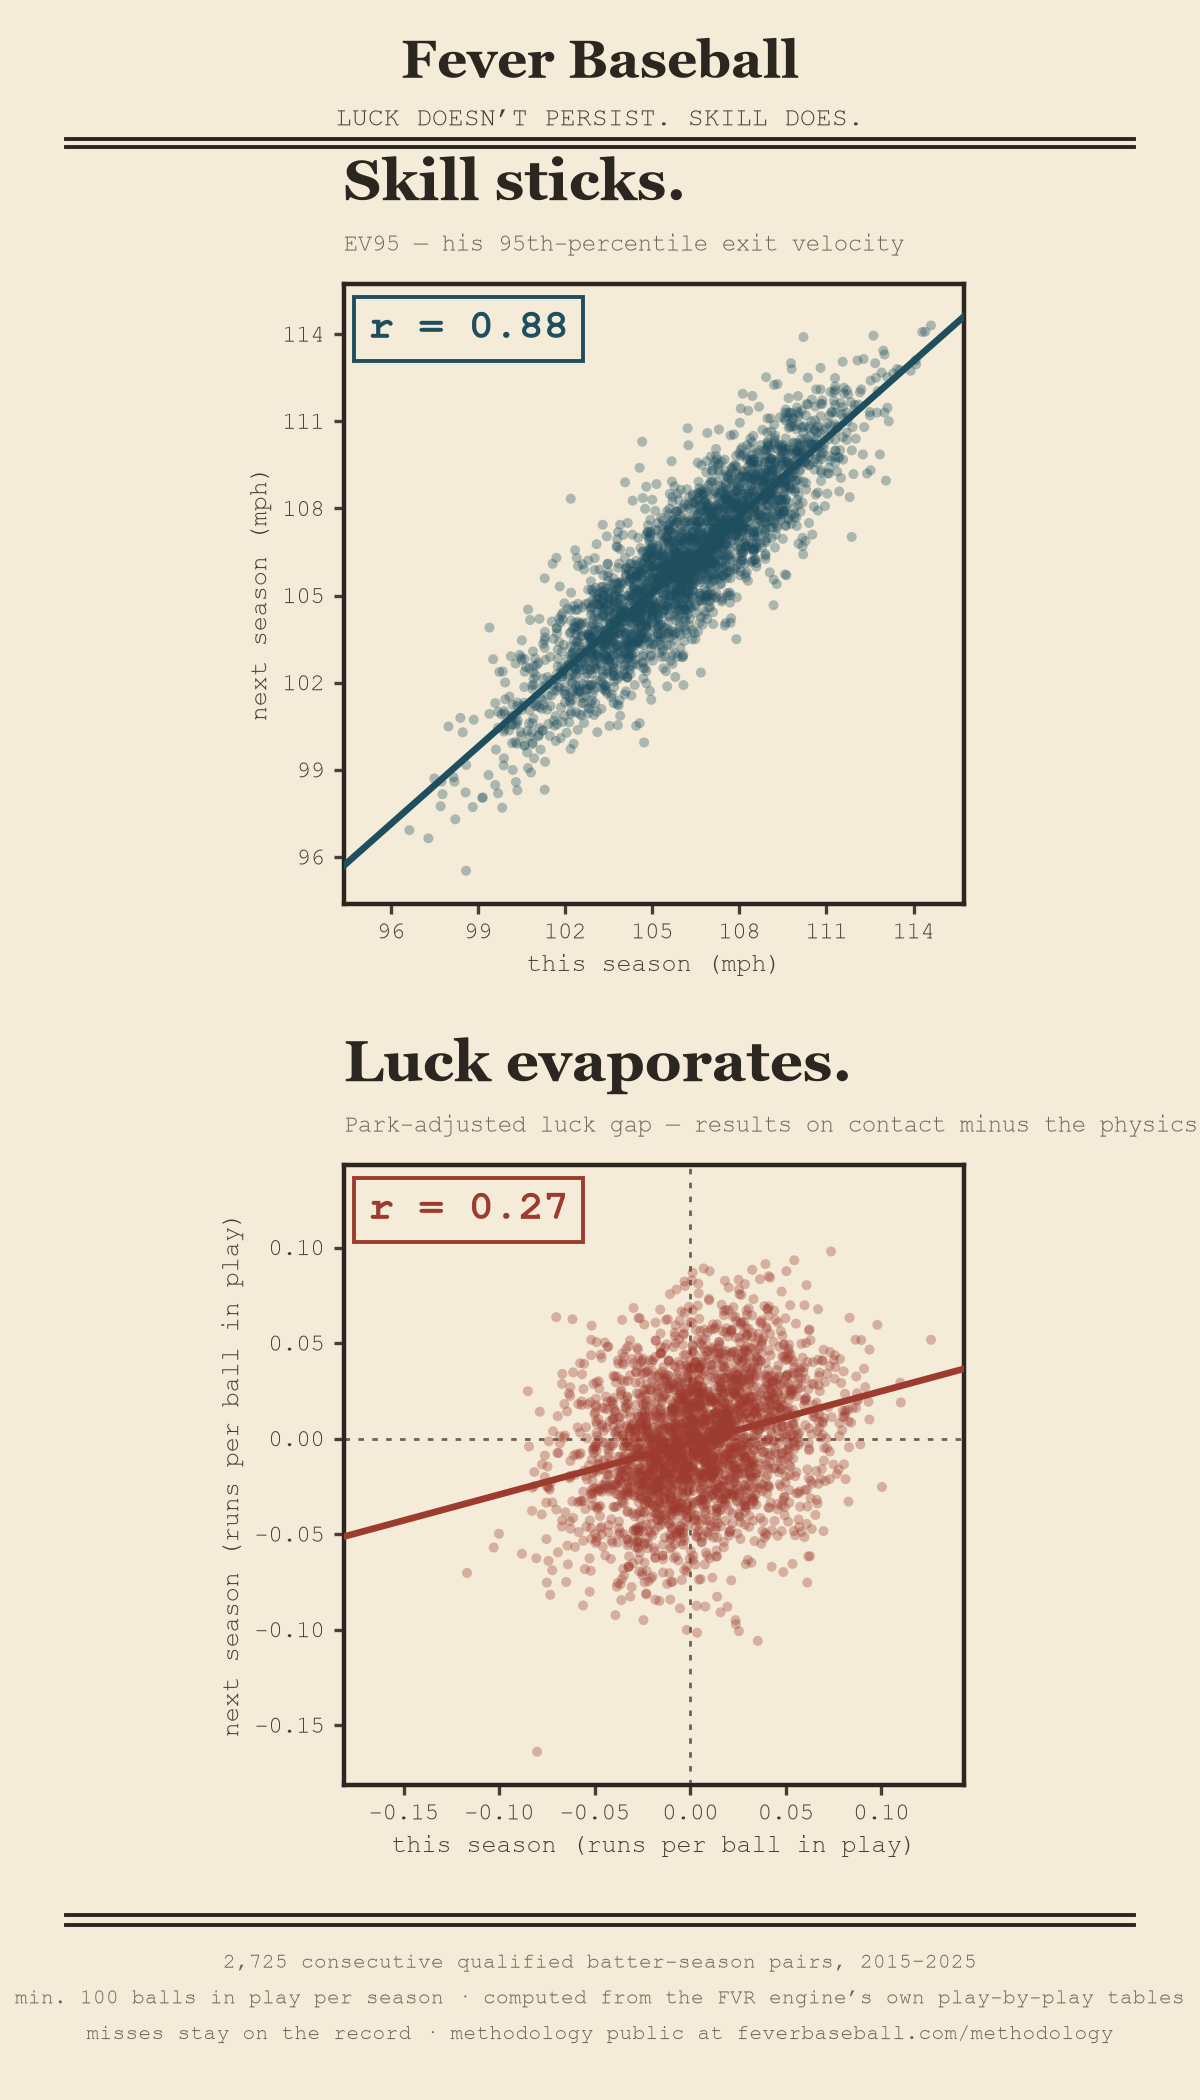
Luck doesn’t persist. Skill does. The whole engine — every board, every call on the ledger — rests on the two pictures below, drawn from 2,725 player-seasons of our own play-by-play tables.
Two hitters. Identical lines.
Silas Reed and Wiley Quinn are both hitting .240 with 18 home runs. The box score cannot tell them apart. The box score doesn’t lie; it just whispers.
Watch the contact instead. Reed’s best swings leave the bat at 108 mph. Quinn’s leave at 88. Same results — one is scorching the ball and getting robbed, the other is blooping his way to the same line.
We measure that difference two ways.
EV95 is a hitter’s 95th-percentile exit velocity — how hard the ball comes off his bat at his best. It is a skill fingerprint. Across 2,725 consecutive qualified batter-season pairs since 2015, a hitter’s EV95 this year predicts his EV95 next year at r = 0.88. It is the most stable thing our engine measures.
The luck gap is what his batted balls actually earned minus what the launch physics say they should have earned, park-adjusted. Quinn’s bloops are running ahead of his contact — a positive gap. Reed’s lasers are running behind his — a negative gap. And unlike EV95, the gap does not hold: year over year it correlates at just 0.27. Most of it is gone by next season.
That pair of numbers is the whole engine. Skill sticks. Luck evaporates. Bloops stop falling; lasers start finding grass. The stat line drifts back toward the physics — natural regression, not magic, and not a hot take.
This is the boards
The overlay simply stacks the two signals: elite contact quality plus an underpaid stat line ranks the Breakout Board; results outrunning contact quality ranks the Fade Board. The signals rank who will out- or under-perform his current value — they do not rank who is best. When a dislocation is big enough, it stops being a board row and becomes a call: filed in public with a metric, a threshold, a window, and a timestamp, resolved by computation when the window closes.
Tested blind, published in full
We froze the test before we looked: models, coefficients, and success criteria were pre-registered, then run once on held-out seasons — 721 qualified batter-seasons the model had never seen. The luck gap predicted future value at -0.6234 WAR per standard deviation (p <0.0001). EV95 added +0.2746. Top-quintile overlay players outgained bottom-quintile by +1.151 annualized WAR. The protocol, the results, and the one bug we found are published in full.
In plain terms: a hitter one big step up the luck gap gave back roughly six-tenths of a win the next season, and a pattern that size arises by chance less than once in ten thousand tries. Rank everyone by both signals together and split them into five groups, and the top group beat the bottom by better than a win over a full year. We wrote the test down and froze it in public before we ran it, once.
Two honest boundaries. These are averages — individual calls will miss, and the public ledger counts every one. And the first verdict lands soon: the record is being written now, in the open.
Take the chart
Repost it, quote it, argue with it — the sourcing is printed on the image and the receipts are one click away. Credit appreciated, never required.
Watch the theory meet the scoreboard
Every call is on the record before the market moves, and every one resolves in public — hit or miss. The boards update nightly; the receipts are permanent.
Or get it in the mail
The Sunday Digest carries the week’s drift and every call’s countdown; The Alerts fires only when a verdict lands.